 The existing methods of assessing the relationship of risk and return in private equity are limited and often unsuitable for assessing or comparing risk across different fund managers and strategies. The prevailing Top Down approach to the consideration of PE risk using aggregate times series data creates numerous challenges. First, listed-private equity vehicles, often used as proxies, are not necessarily representative of typical private investment performance. Second, the many private equity databases currently used to assess performance consist of older funds (15+ years) for which NAVs were not marked to market as they are today. Third, there is also no consideration of individual transactions and therefore no specific treatment for different investment years, industry segments or deal sizes.
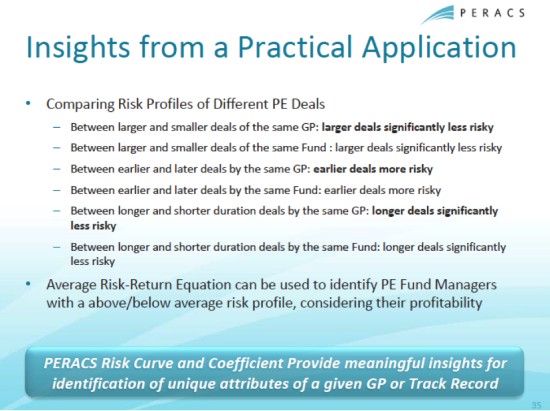
On the contrary, the PERACS Alpha captures annualized relative returns of PE investments in an accurate and unbiased fashion, also at the deal level. PERACS’ risk coefficient provides a meaningful measure of risk for PE portfolios. In a recent analysis of 152 PE GPs and their 263 PE Funds (always at least with 9 realized investments), PERACS found a statistically significant negative correlation between risk and return which was confirmed by the comparison of risk and return of 600 PE sectors, characterized by geography, industry, size, period, (such as Small Cap, 1995-1999, North America, Healthcare), always at least with 9 realized investments.
In other words, the most capable GPs delivered greater Alpha at lower return volatility, while less capable GPs create less value and made more mistakes.
A GP’s “PERACS Alpha” is a measure of pure value generation that is corrected for the biases of standard IRR and expresses returns relative to the opportunity cost of not investing in the public market. It is based on a refinement of the method developed by Acharya, Gottschalg et al. (Review of Financial Studies, 2012). The “PERACS Risk Curve” captures cumulative distribution function of the distribution of performance in a PE portfolio. Similar to the “Gini Coefficient” for wealth distribution, the “PERACS Risk Curve” captures the distribution of performance in a single measure, which makes it possible to compare and benchmark the risk of different PE portfolios in a measure that is independent of the performance of these portfolios.
PERACS has access to unique data made possible through its partnership with HEC Paris. PERACS access to this unique data and its standardized methodology allows for effective identification of true outperformers.
In fact, close to 10% of the PE industry has used PERACS analysis in the past 12 months to enhance both fundraising and investor communications.