
 The most recent wave of returns from private equity investments has certainly made institutional investors take notice. Nevertheless, many public pension funds committed to private equity have been adopting a more customized approach to PE.
This customization is taking many forms. Some are looking to invest directly or alongside GPs via co-investments. Others are creating separate accounts with major PE players. (For instance, Teacher Retirement System of Texas recently approved two new $1 billion separate accounts to be managed by KKR and Apollo that will invest in credit and debt-related opportunities, including funds and co-investments managed by the two PE giants.) Some investors are staying away from the mega funds and targeting middle-market funds or first-time funds. Yet others are revaluating their allocation to the asset class altogether. Last May, CalPERS’ “investment committee set an interim portfolio allocation target of 10% for private equity, taking pressure off the pension fund to rush to meet a 12% long-term target.” (WSJ)
 These allocation decisions and dynamic market variables are making for evermore diverse private equity portfolios amongst pension funds, and thus emphasizing the necessity for adequately evaluating the risk profile of the broad spectrum of a fund’s private equity commitments.
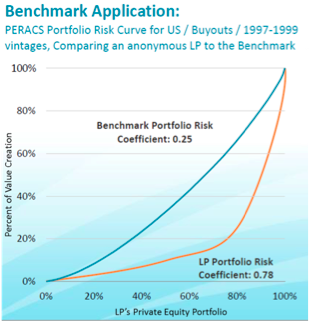
Previous posts have elaborated on how the PERACS Risk Curve can be utilized to evaluate a GP’s investments both on a deal-by-deal and fund basis. In addition, the PERACS Portfolio Risk Curve can be used to measure the collective risk profile of an LPs’ diverse private equity commitments and compare the risk profile to the benchmark coefficient seen by the market.
In the example graph provided, the performance dispersion of the US Buyout investments of this Anonymous LP show a substantially greater performance dispersion than the benchmark for this segment. The worst 70% of funds of this LP generated less than 20% of overall returns (compared to approx. 50% for the benchmark), while the best 20% of the funds generate almost 80% of the returns (compared to less than 40% for the benchmark).
As the private equity industry continues to evolve and investors adapt to new market dynamics, the need to understand the characteristics of your portfolio on a more detailed basis will be even greater. PERACS Portfolio Risk Curve, is one of many tools that can help you do just that.